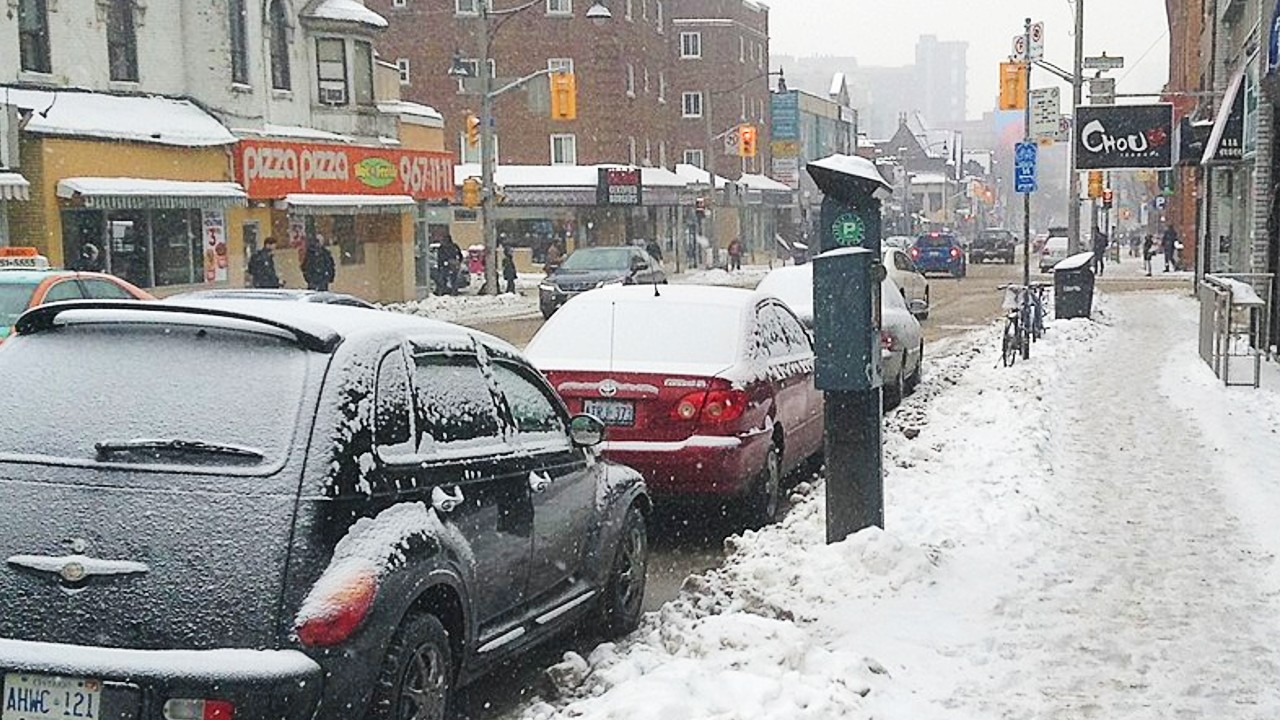
What parts of Toronto receive the most parking tickets?
With the help of open data, we mapped parking machine and street permit infractions to find the most-ticketed areas.

There are a lot of ways to receive a parking ticket in Toronto, from standing too long in a bus loading zone to parking in a fire route. The fines for each can range from $15 to $450.
According to recently released data, the City of Toronto issued more than 1,821,887 parking tickets in 2022, which resulted in $96,347,560 in fines.
Some of the most common tickets are for infractions related to street permits and parking machines — both on the street and in City-owned Green P lots. These are tickets related to spots for use by the general public — a finite resource we all share, locals and visitors alike.
But which areas do these tickets come from? Are they spread out evenly across the city, or are they focused almost entirely on the downtown core?
No and no, as it turns out.
We mapped a slice of the aforementioned data to find the most-ticketed areas. (Note: The visualization does not include the entire City dataset. For this piece, we’ve carved out just parking machine and permit-related tickets.)
Check out the map to interact with the data, and read on for some key takeaways.
Types of infractions
For the visualization, we rounded up every different micro type of machine and permit-related infraction we could find, from “PARK OVERNIGHT NO PERMIT” to “PARK MACHINE-FAIL TO ACTIVATE.”
This resulted in a total of 617,596 tickets with a fine amount of $21,246,620 — or roughly a quarter all tickets and fines.
Here are the top 10 infractions by number of tickets in our selected subset of the data, with total fine amount for good measure:
| Infraction | No. of tickets | Total fines |
|---|---|---|
| 207 - PARK MACHINE-REQD FEE NOT PAID | 284,719 | $8,541,570 |
| 29 - PARK PROHIBITED TIME NO PERMIT | 263,450 | $7,903,500 |
| 312 - PARKING MACH-NOT USED/NO FEE | 58,743 | $4,405,725 |
| 336 - PARK-FAIL TO DISPLAY PERMIT | 8,684 | $260,520 |
| 313 - PARK-FAIL TO ACTIVATE MACHINE | 1,505 | $112,875 |
| 208 - PARK MACHINE-FAIL TO ACTIVATE | 194 | $5,820 |
| 255 - PARK OVERNIGHT NO PERMIT | 101 | $10,100 |
| 209 - PARK MACHINE-NOT IN PERMITD TM | 100 | $3,000 |
| 335 - PARK MORE THAN 7DAYS NO PERMIT | 97 | $2,910 |
| 424 - PARK BUS-FAIL TO ACTIV MACHINE | 2 | $600 |
As you can see in the table above, the most common ticket here is for “PARK MACHINE-REQD FEE NOT PAID,” or infractions where someone didn’t pay the proper amount for the time used — in other words, the meter ran out.
Next most common was for parking at a prohibited time without a proper permit. These two combined make up nearly 89 per cent of the total tickets in our dataset, and just more than 77 per cent of total fines.

Parking ticket hot spots
Zooming out on the map visualization reveals some predictable hot-spot areas. The downtown Yonge corridor, Queen St. W., and both Bloor St. W. and the Danforth see a lot of ticket activity.
But a zoom in reveals some interesting individual locations:
- The most ticketed address in the dataset is 20 Ashbridges Bay Park Rd., by Woodbine Beach. This lot racked up 2,073 tickets, or an average of 5.7 per day, and resulted in a whopping $155,475 in fines.
- Right underneath that on the list is another lakefront location: 15 Marine Parade Dr., by Humber Bay Shores. The result here was 1,714 tickets, but just $51,420 in fines. The majority of tickets here will net you just a $30 fine because parking spaces are technically on a city street. (In general, fines in Green P parking lots are stiffer.)
- Perhaps the most heavily ticketed area on Bloor St. W. is in Bloor West Village. Four lots between Jane St. and Glendowynne Rd. each saw more than 700 tickets. The most-ticketed of them — 265 Durie St. — had 1,214 tickets and $91,050 in fines.
- A major earner for the City was a parking lot near the Weston GO Station at 16 John St. Here, 1,361 tickets resulted in $102,075 in fines.
What’s the trend?
As Matt Elliott pointed out in a recent article for the Toronto Star, the total number of tickets issued by the City has been dropping in recent years — even before numbers took a steep dive in 2020 and 2021 due to the pandemic.
In 2011, the City issued 2.8 million tickets, and the number was 2.2 million in the final year before the pandemic. With that as a comparison point, 2022’s 1.8 million tickets seems rather low.
There are several potential reasons for the drop, including the Green P app making it easier for people to extend parking time without running back to the machine closest to their spot.
But as the data presented here attests, certain spaces and lots throughout the city — including those nearby popular parks along the waterfront, and on major streets through high-traffic neighbourhoods — are still hot spots for ticket activity.
In other words: Parker still beware. (And pay the machine if you don’t want fines.)
Code and markup by Chris Dinn. ©Torontoverse, 2023